
Dendrogram | Sequence Clustering | Sequence Activity Relationship | SARvision
Analyzing Sequence Activity Relationships using Interactive Dendrograms
by Mark Hansen, Ph.D.

Dendrograms are an excellent way to cluster sequences by similarity or data to visualize Sequence Activity Relationships.
A dendrogram depicts hierarchical relationships between sequences to group them into families. Clustering algorithms are used to create these hierarchies and can operate on sequence identity or any series of numerical data as a measure of similarity. Leaf nodes represent sequences in the data-set and are grouped by similarity under higher nodes in the dendrogram tree. The longer the horizontal line connecting two groups of sequences, the greater the distance between the families of sequences: nodes lower on the tree (closer to the right) are groups of more closely related sequences, while nodes higher in the tree (closer to the left) represent families of sequences that are more loosely related. In SARvision, dendrograms are built on demand through an interactive interface.

Dendrogram depicting Somatostatin analogs grouped by sequence identity. Note the ‘Cluster by’ drop down allows selection by the user of any data to build dendrograms of sequences on demand.
A drop-down allows the user to choose sequence identity or any column of data to cluster sequences to build the hierarchical tree. The dendrogram remains static, but can be rebuilt when when data is added, removed or changed by clicking the Rebuild button. In the below diagram, the dendrogram has been rebuilt using the same Somatostatin data but instead clustered by the SST4 receptor.

Dendrogram depicting Somatostatin analogs grouped by sequence activity to SST4 receptor. The dendrogram looks markedly different to the tree built using sequence identity.
In addition to building dendrograms using different available data, the dendrogram can be heat-mapped by any column of numeric data. The Heat-Map button is a drop down that allows the user to select any column of data to change the heat-map color of the dendrogram. In this way, the user can add a dimension of data to the dendrogram view. Using a heat-map below, sequences active toward the SST2 receptor are colored in green while inactive sequences are in red. Note the double gradient used to color sequences of medium activity varying shades of yellow/orange. Groups of similar sequences that are active can be easily identified in this way for further study.

Dendrogram with a heat-map illuminating pockets of activity against the SST2 receptor.
Using the Subsets filter panel (lower left), a range of activity can be defined for multiple columns of data. For example, selection for sequences that are active against the SST1 receptor and inactive against the SST4 receptor can be defined using range filters. Setting the Mark by drop down to this subset, Subset 1, will color the sequences that match the defined criteria. Using the subset filters, the user can interactively change the sequences that are colored to dial in an activity range. Note that the Mark by color overrides any heat map color.
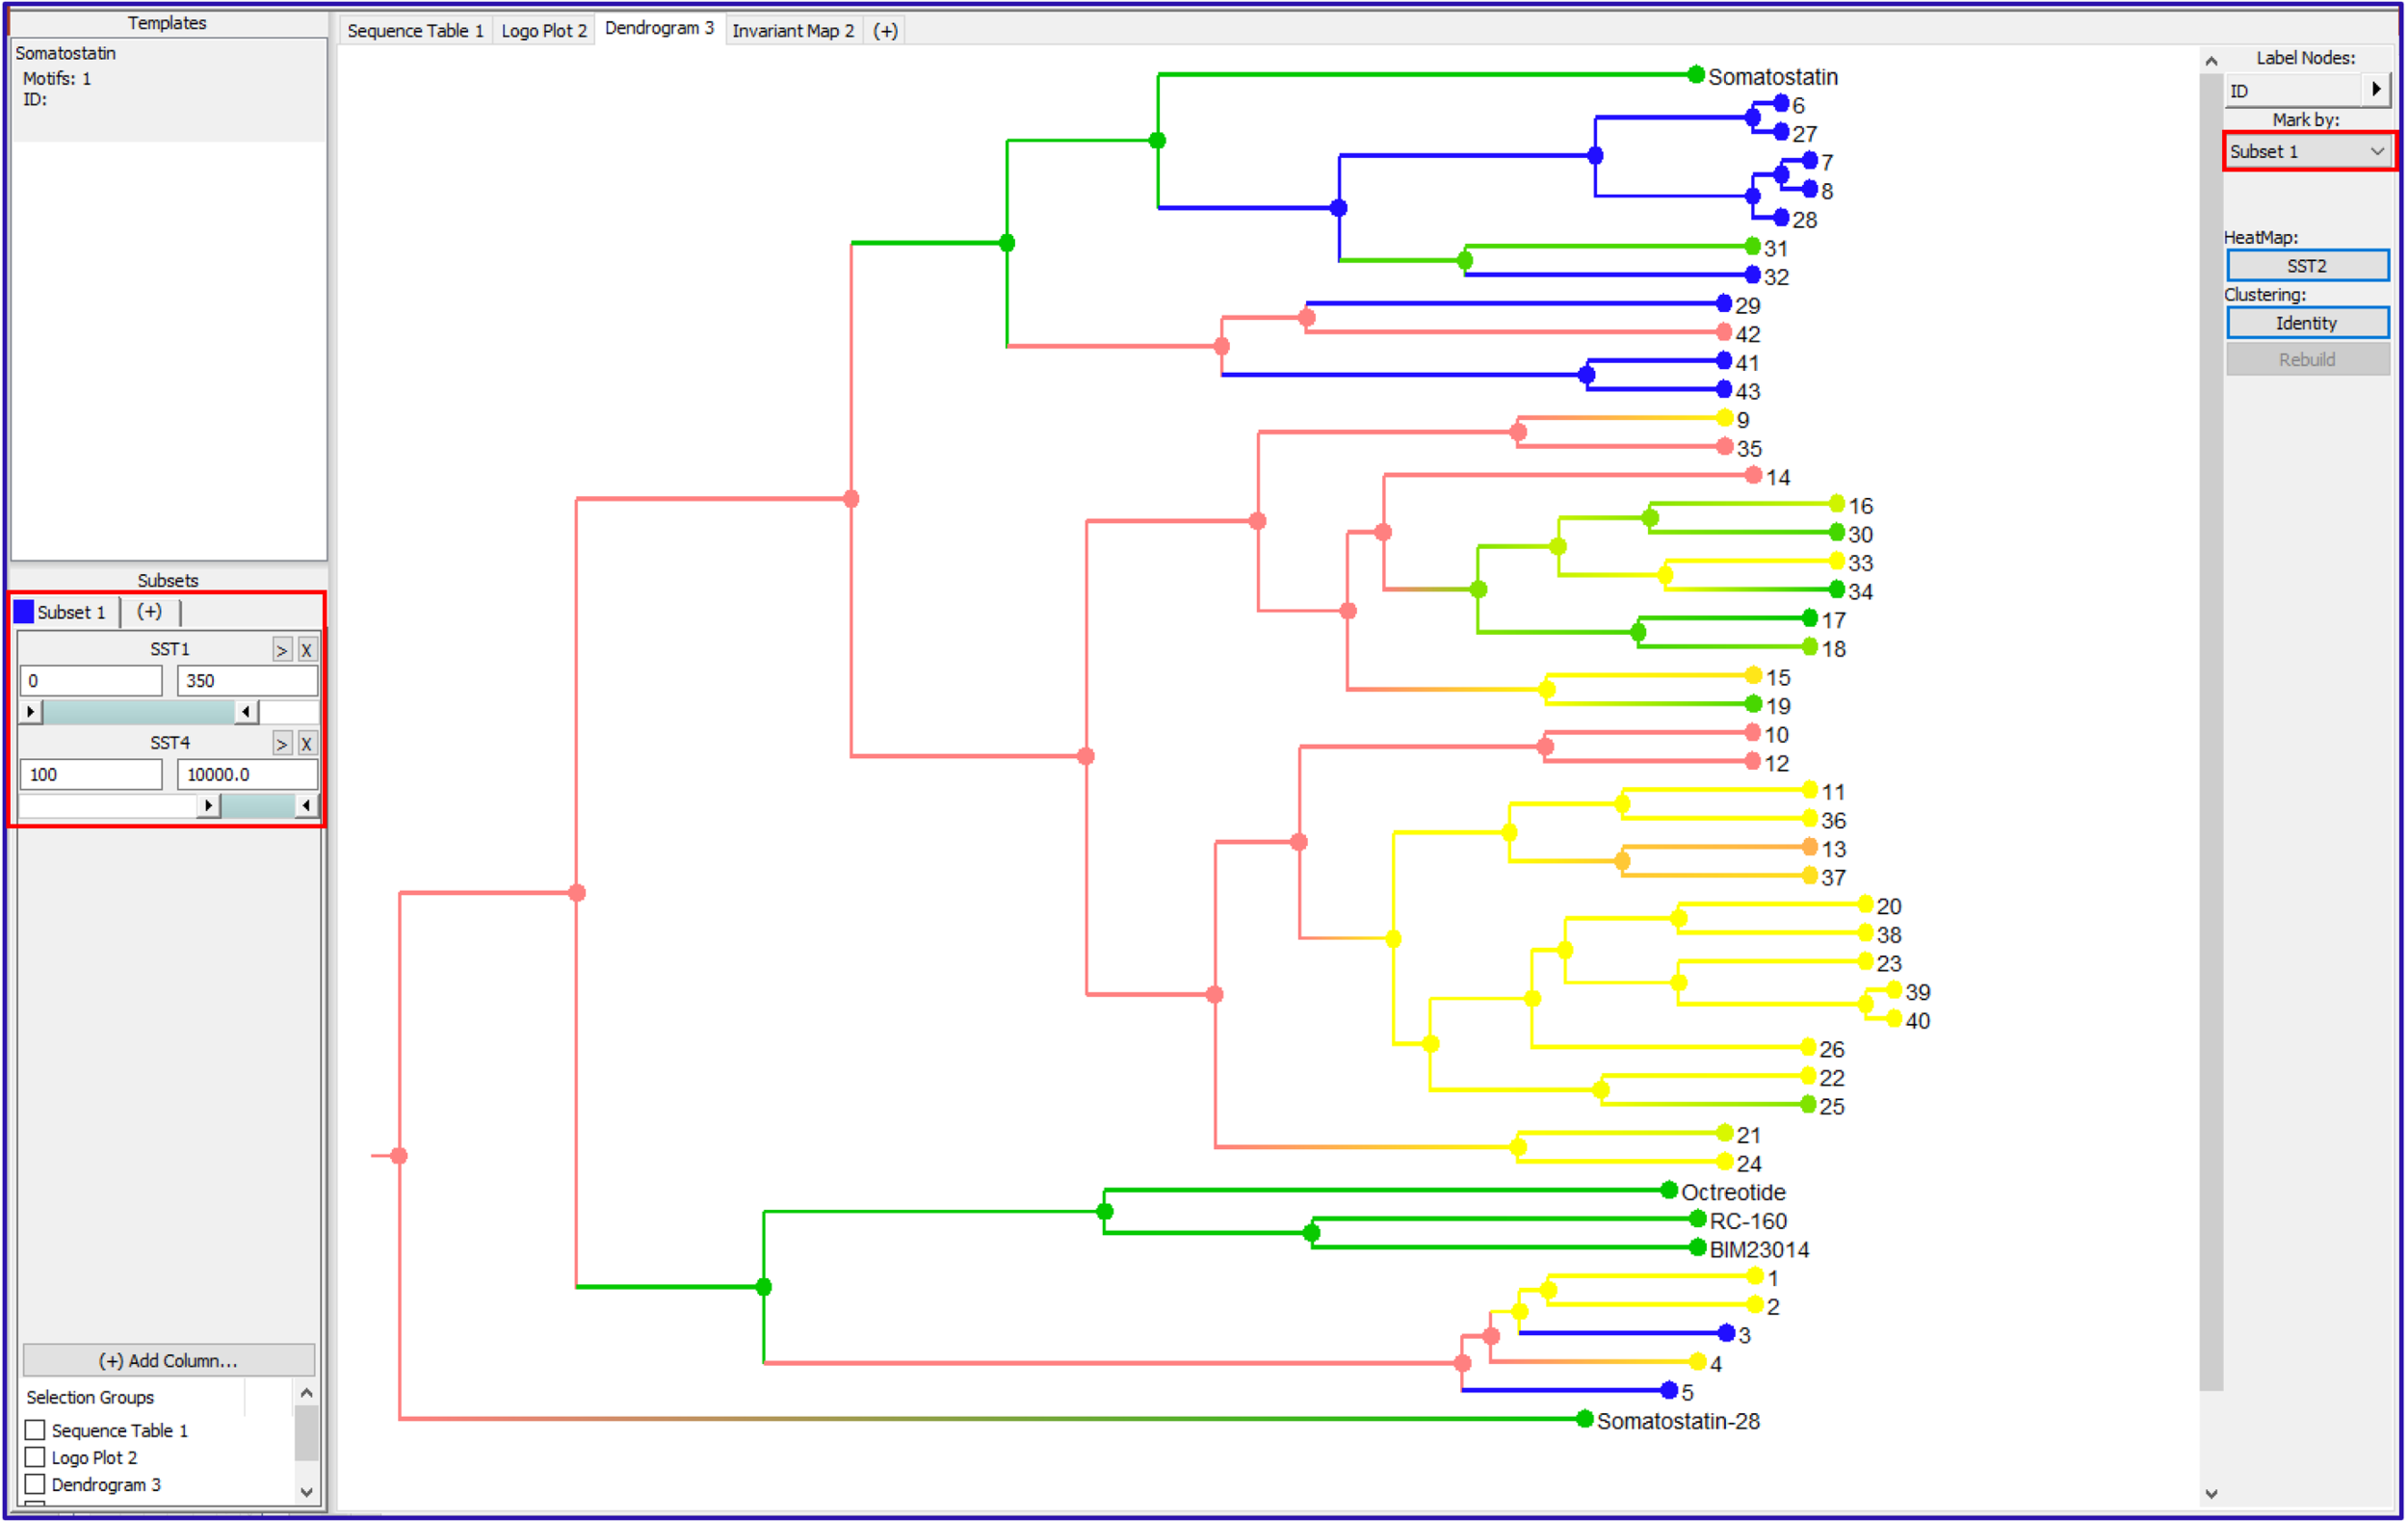
Interactive highlighting of sequences in the Dendrogram using range filters.
The dendrogram nodes can be used to summarize data. The node average, the average of the two children nodes, is displayed in the mouse over for both the heat-map column and the column used in clustering if applicable. Clicking on a node selects the family of sequences that it represents and can add it to a subset (check the Dendrogram box in the subset). This subset can now be used to modify other views. In the case below, the dendrogram is used to select sequence rows and add them to subset 1. Under Main menu->Views show both panels, then move the Dendrogram to the second panel (right click on the dendrogram tab->move to other panel). The Sequence table can then be filtered by the subset by selecting Subset 1 in the Sequence table control. This creates an interactive display where clicking on nodes shows all the data for that subset of sequences in that family.
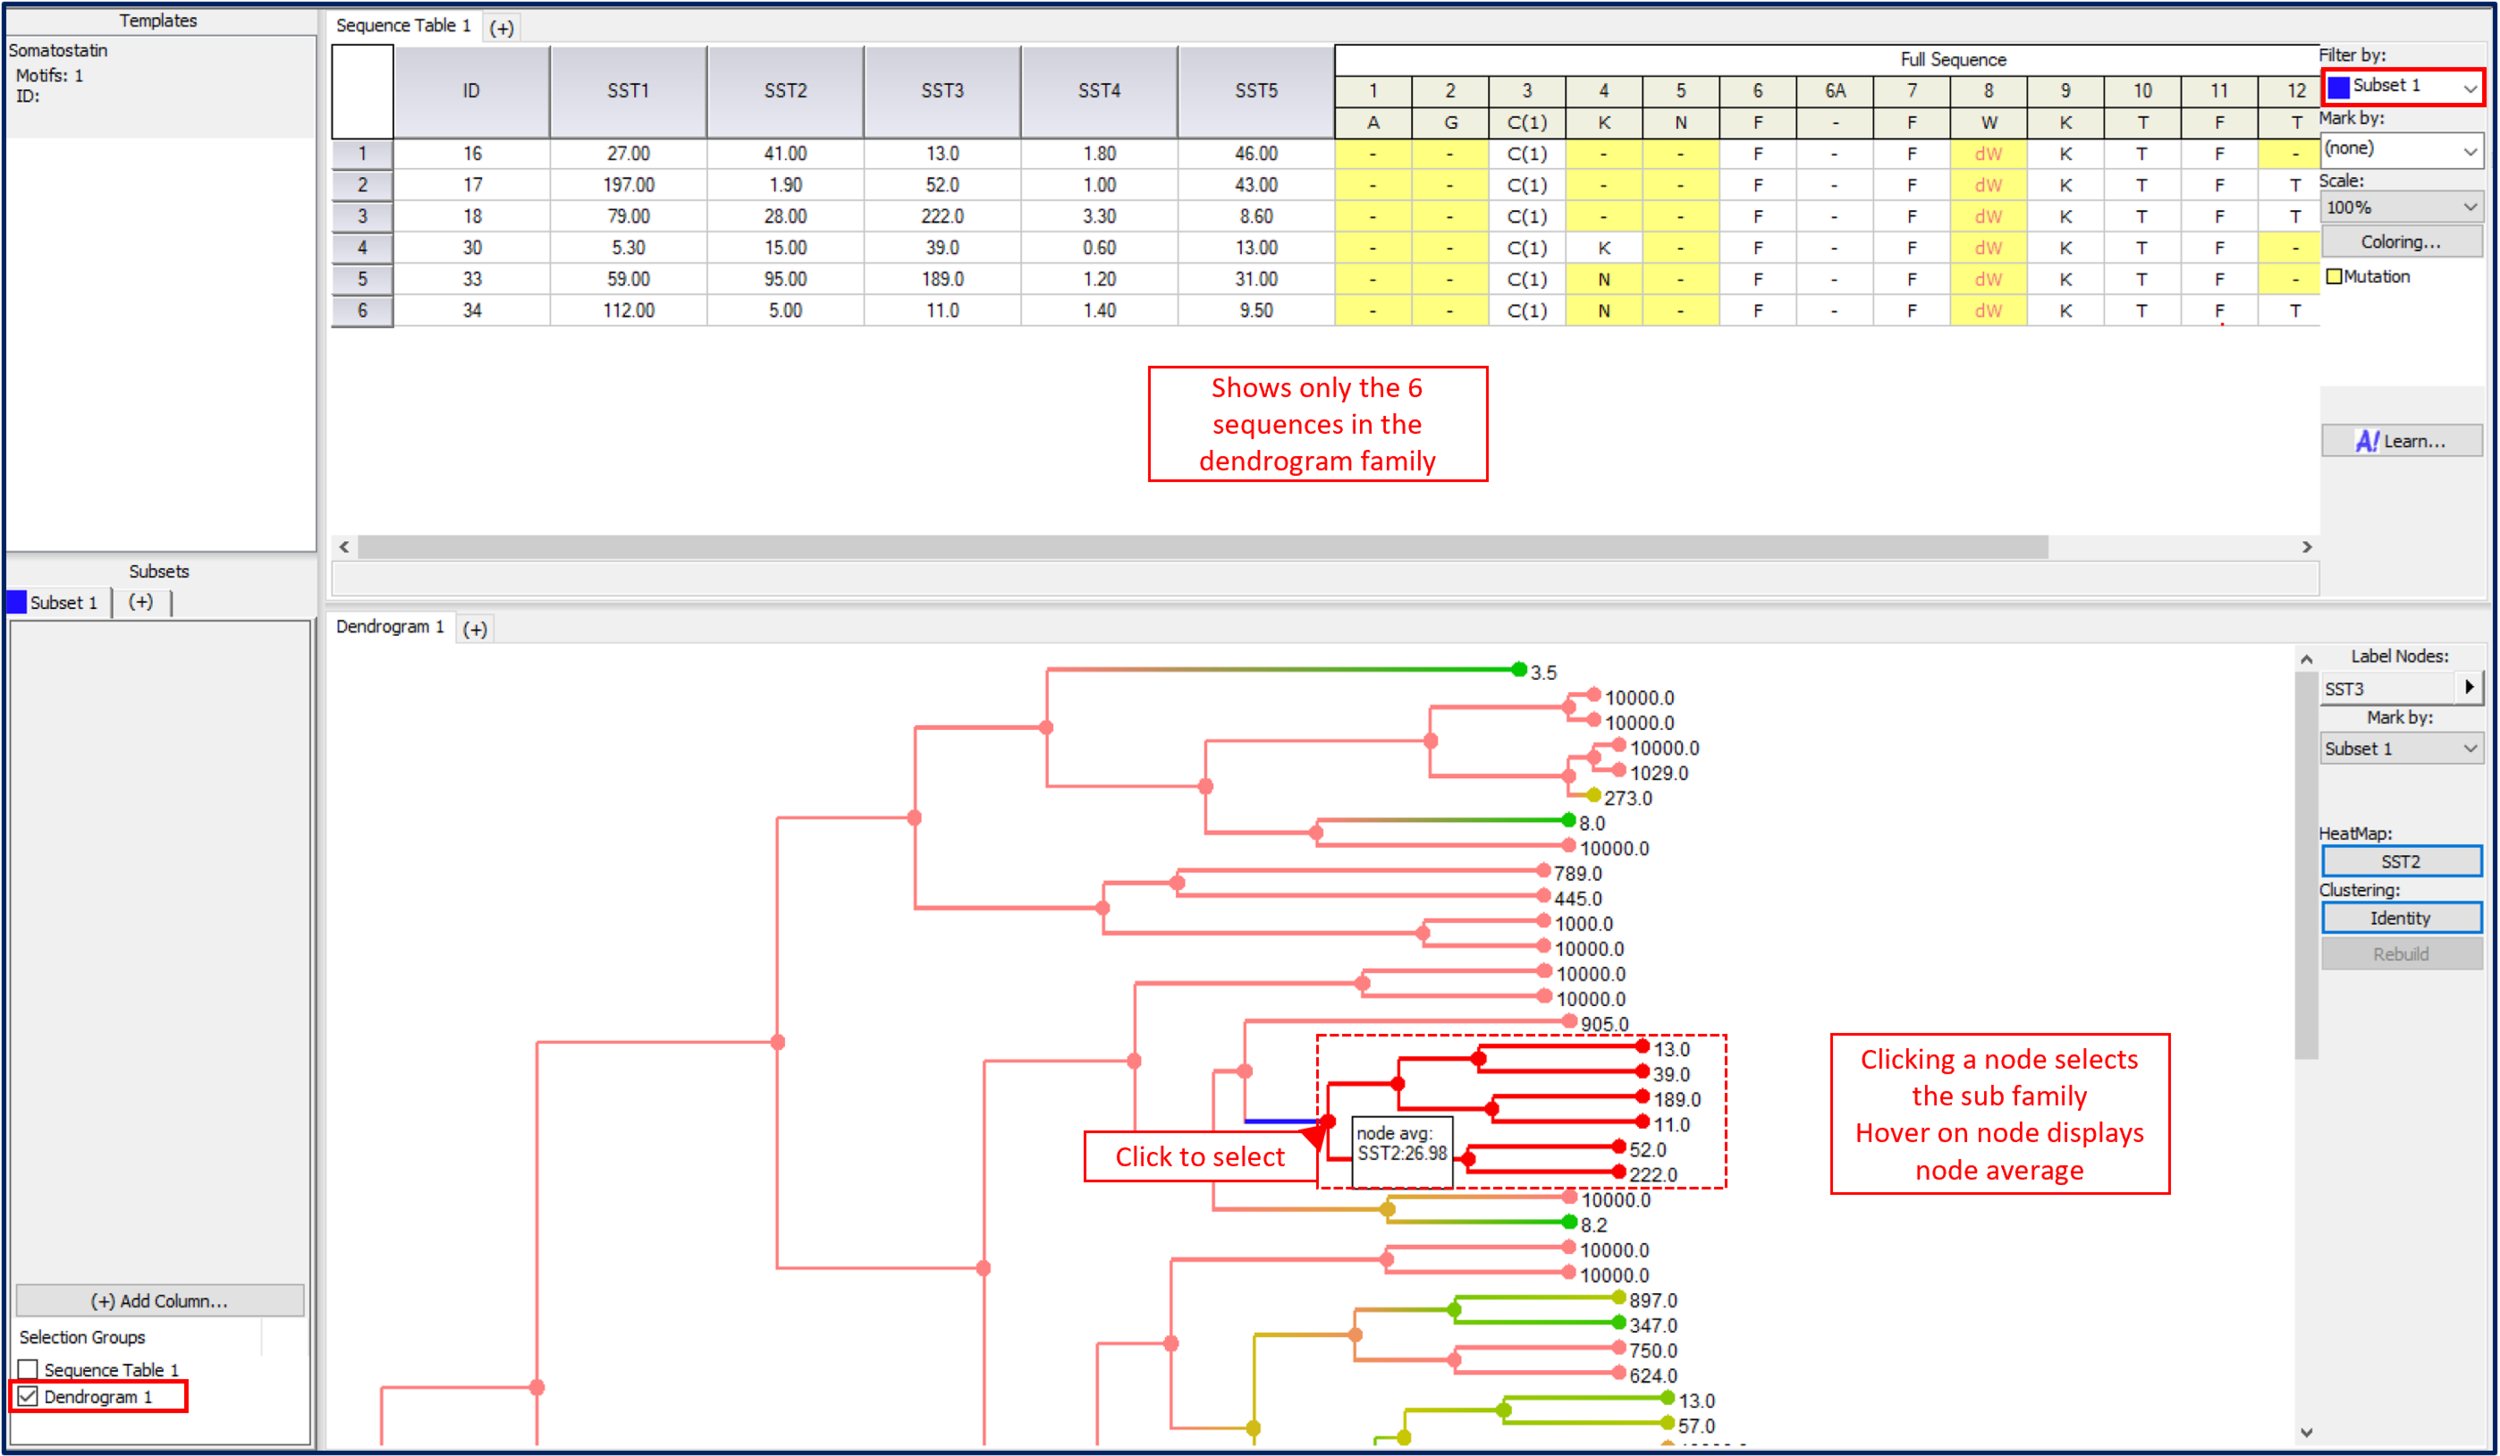
An interactive display can be set up to filter Sequence tables by selection in the Dendrogram view.