
SARvision | PROTAC| SAR | Bi-Ligand | Linker | Structure Activity Relationship
Analyzing PROTAC Structure-Activity Relationships
by Mark Hansen, Ph.D.

Performing SAR analysis on bi-ligands such as PRTOACS requires tools that can identify the linker and break the molecule into its constituent parts.
Medicinal chemists often link two ligands together through a linker to achieve a new and novel biological activity. PROTAC molecules best exemplify this approach where an E3 ligase modulator is linked to a warhead ligand that recruits a protein target for degradation. However, there is a gap in the tools that easily decompose these molecules into their constituent components to perform structure-activity analysis on a routine basis.
The linker analysis module has been added to SARvision|SM to fill this gap and make SAR studies of bi-ligands routine and painless to perform. This new analysis tool is designed to study PROTACs, but could work on any set of molecules that are two ligands joined by a linker. The algorithm identifies and decomposes the molecules into a linker and the two ligands such that they can be easily analyzed using SAR tables employed by SARvision|SM. For PROTAC molecules, the E3 ligase modulator is identified and positioned on the left side. The linker is extended horizontally between the two ligands. The remaining moiety, the targeting warhead, is oriented to the right.
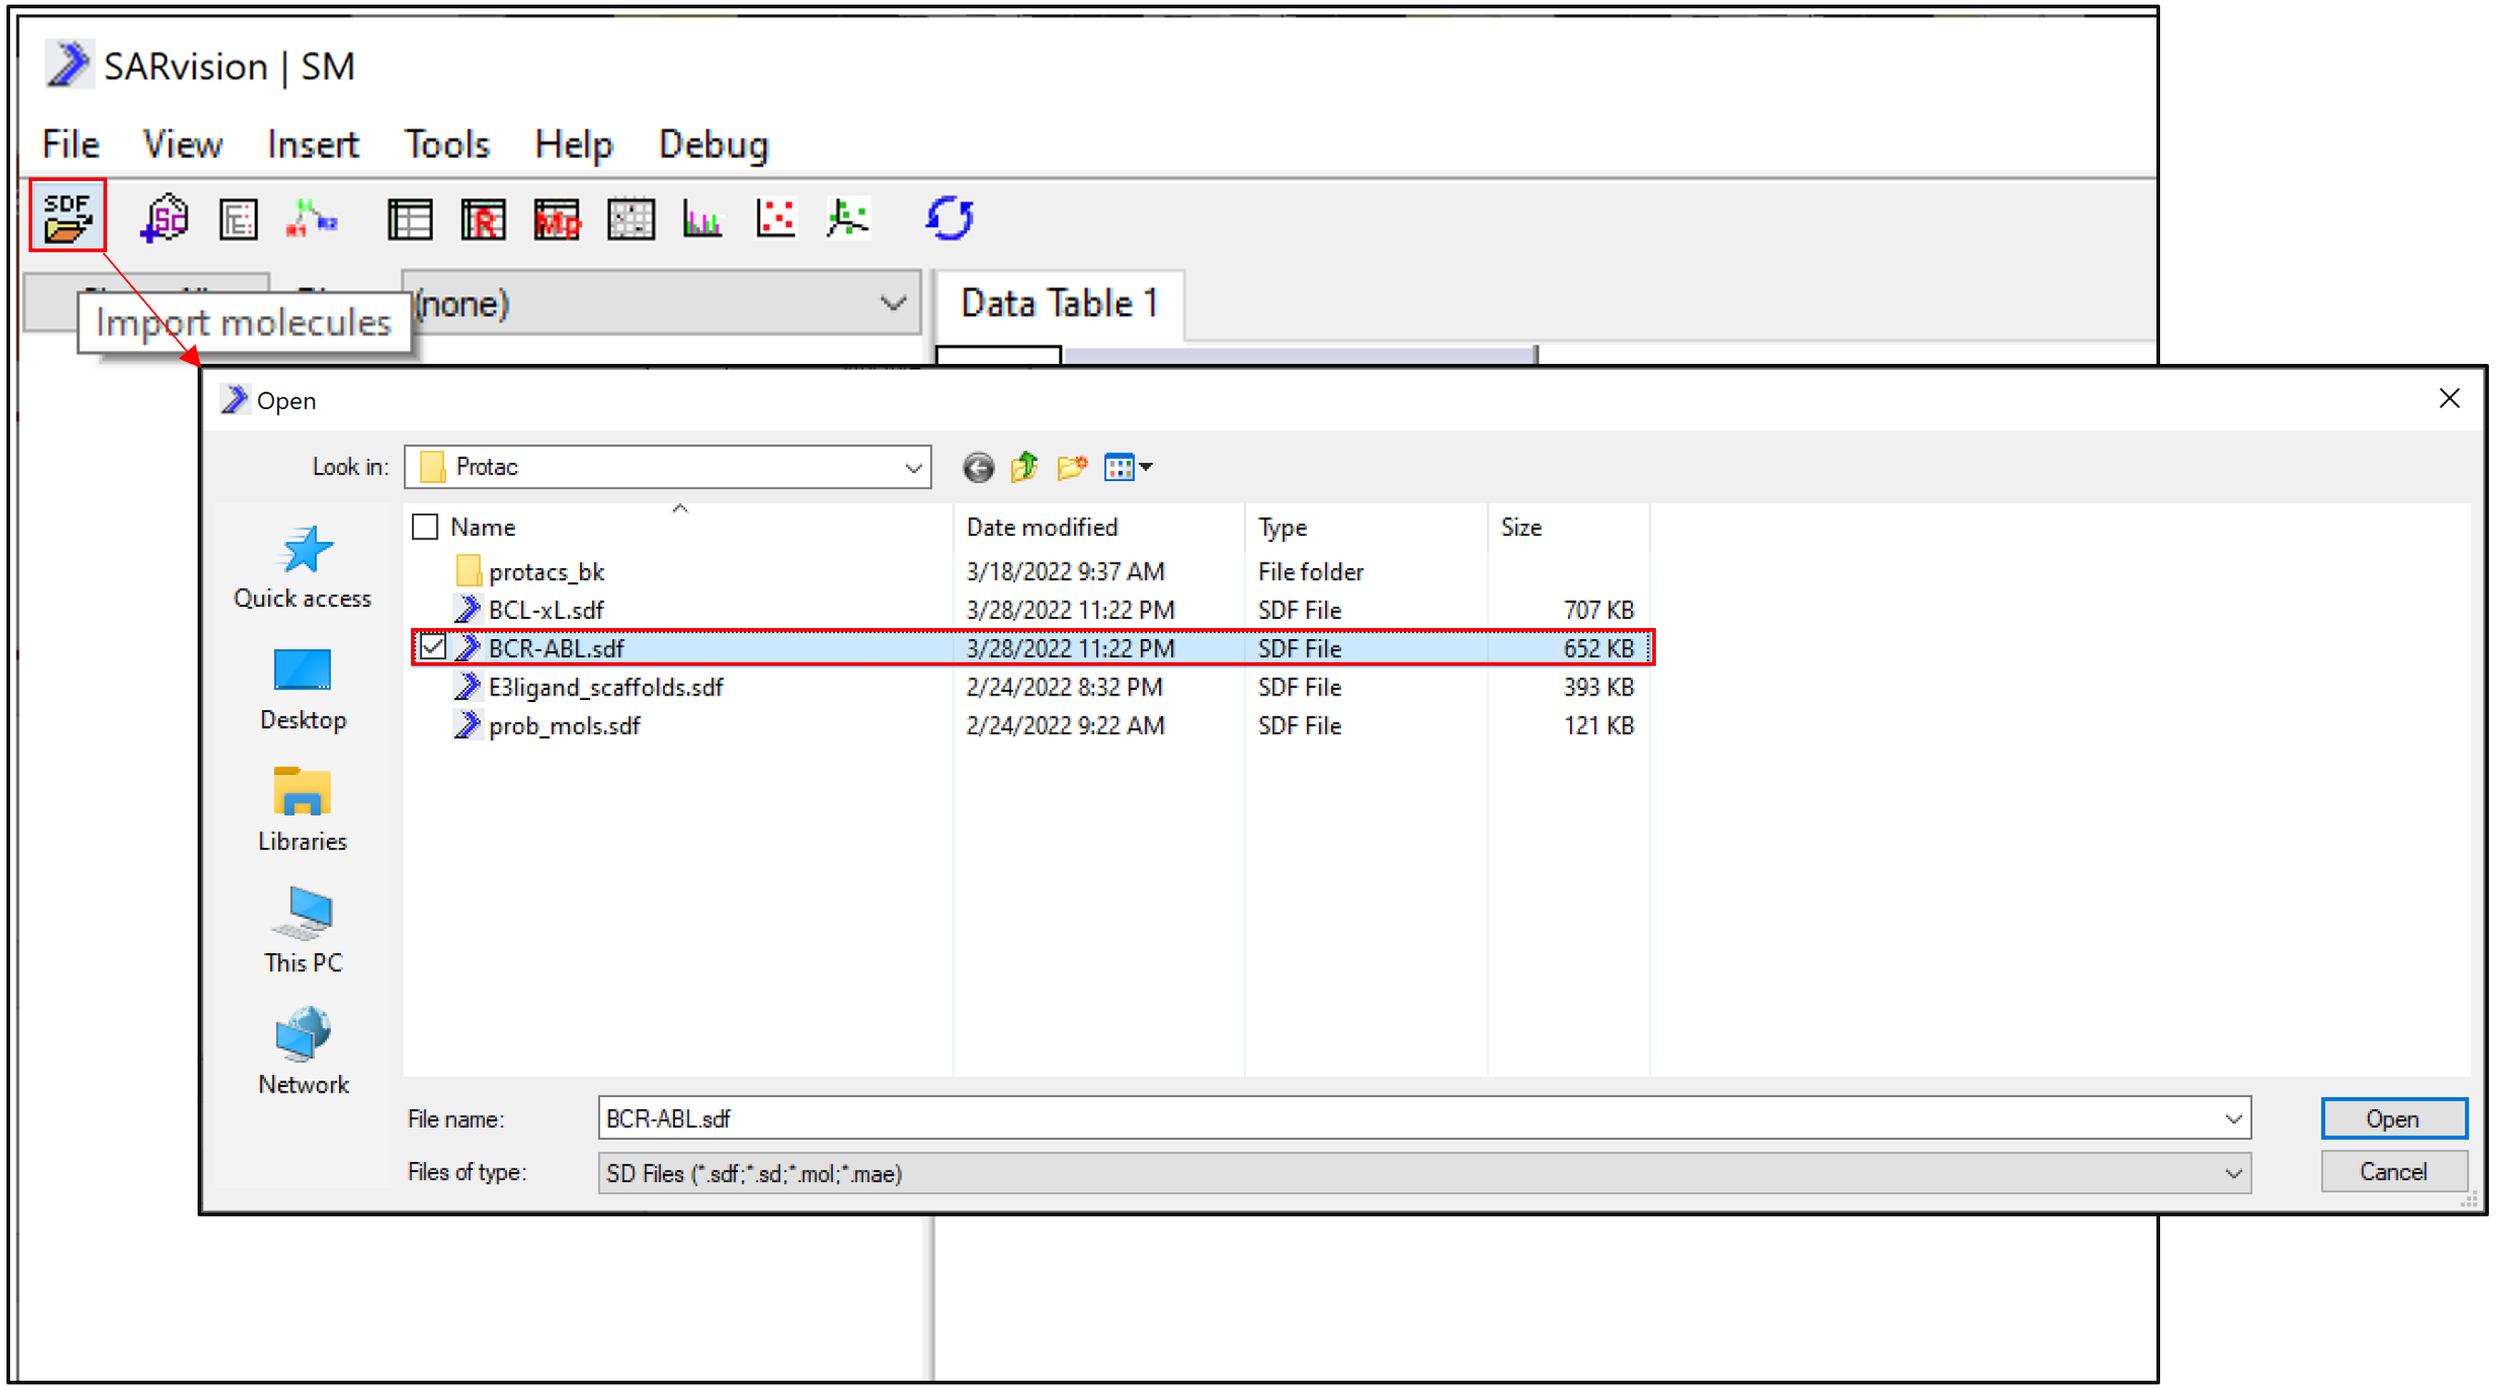
Molecules in SDF or smiles format can be easily imported into SARvision|SM (file->import molecles : loads SDF, Smiles). A set of molecules designed to degrade BCR-ABL can be loaded for study (download here). We are using a set obtained from PROTAC DB: Nucleic Acids Research, 2020. Doi: 10.1093/nar/gkaa807 for this example.
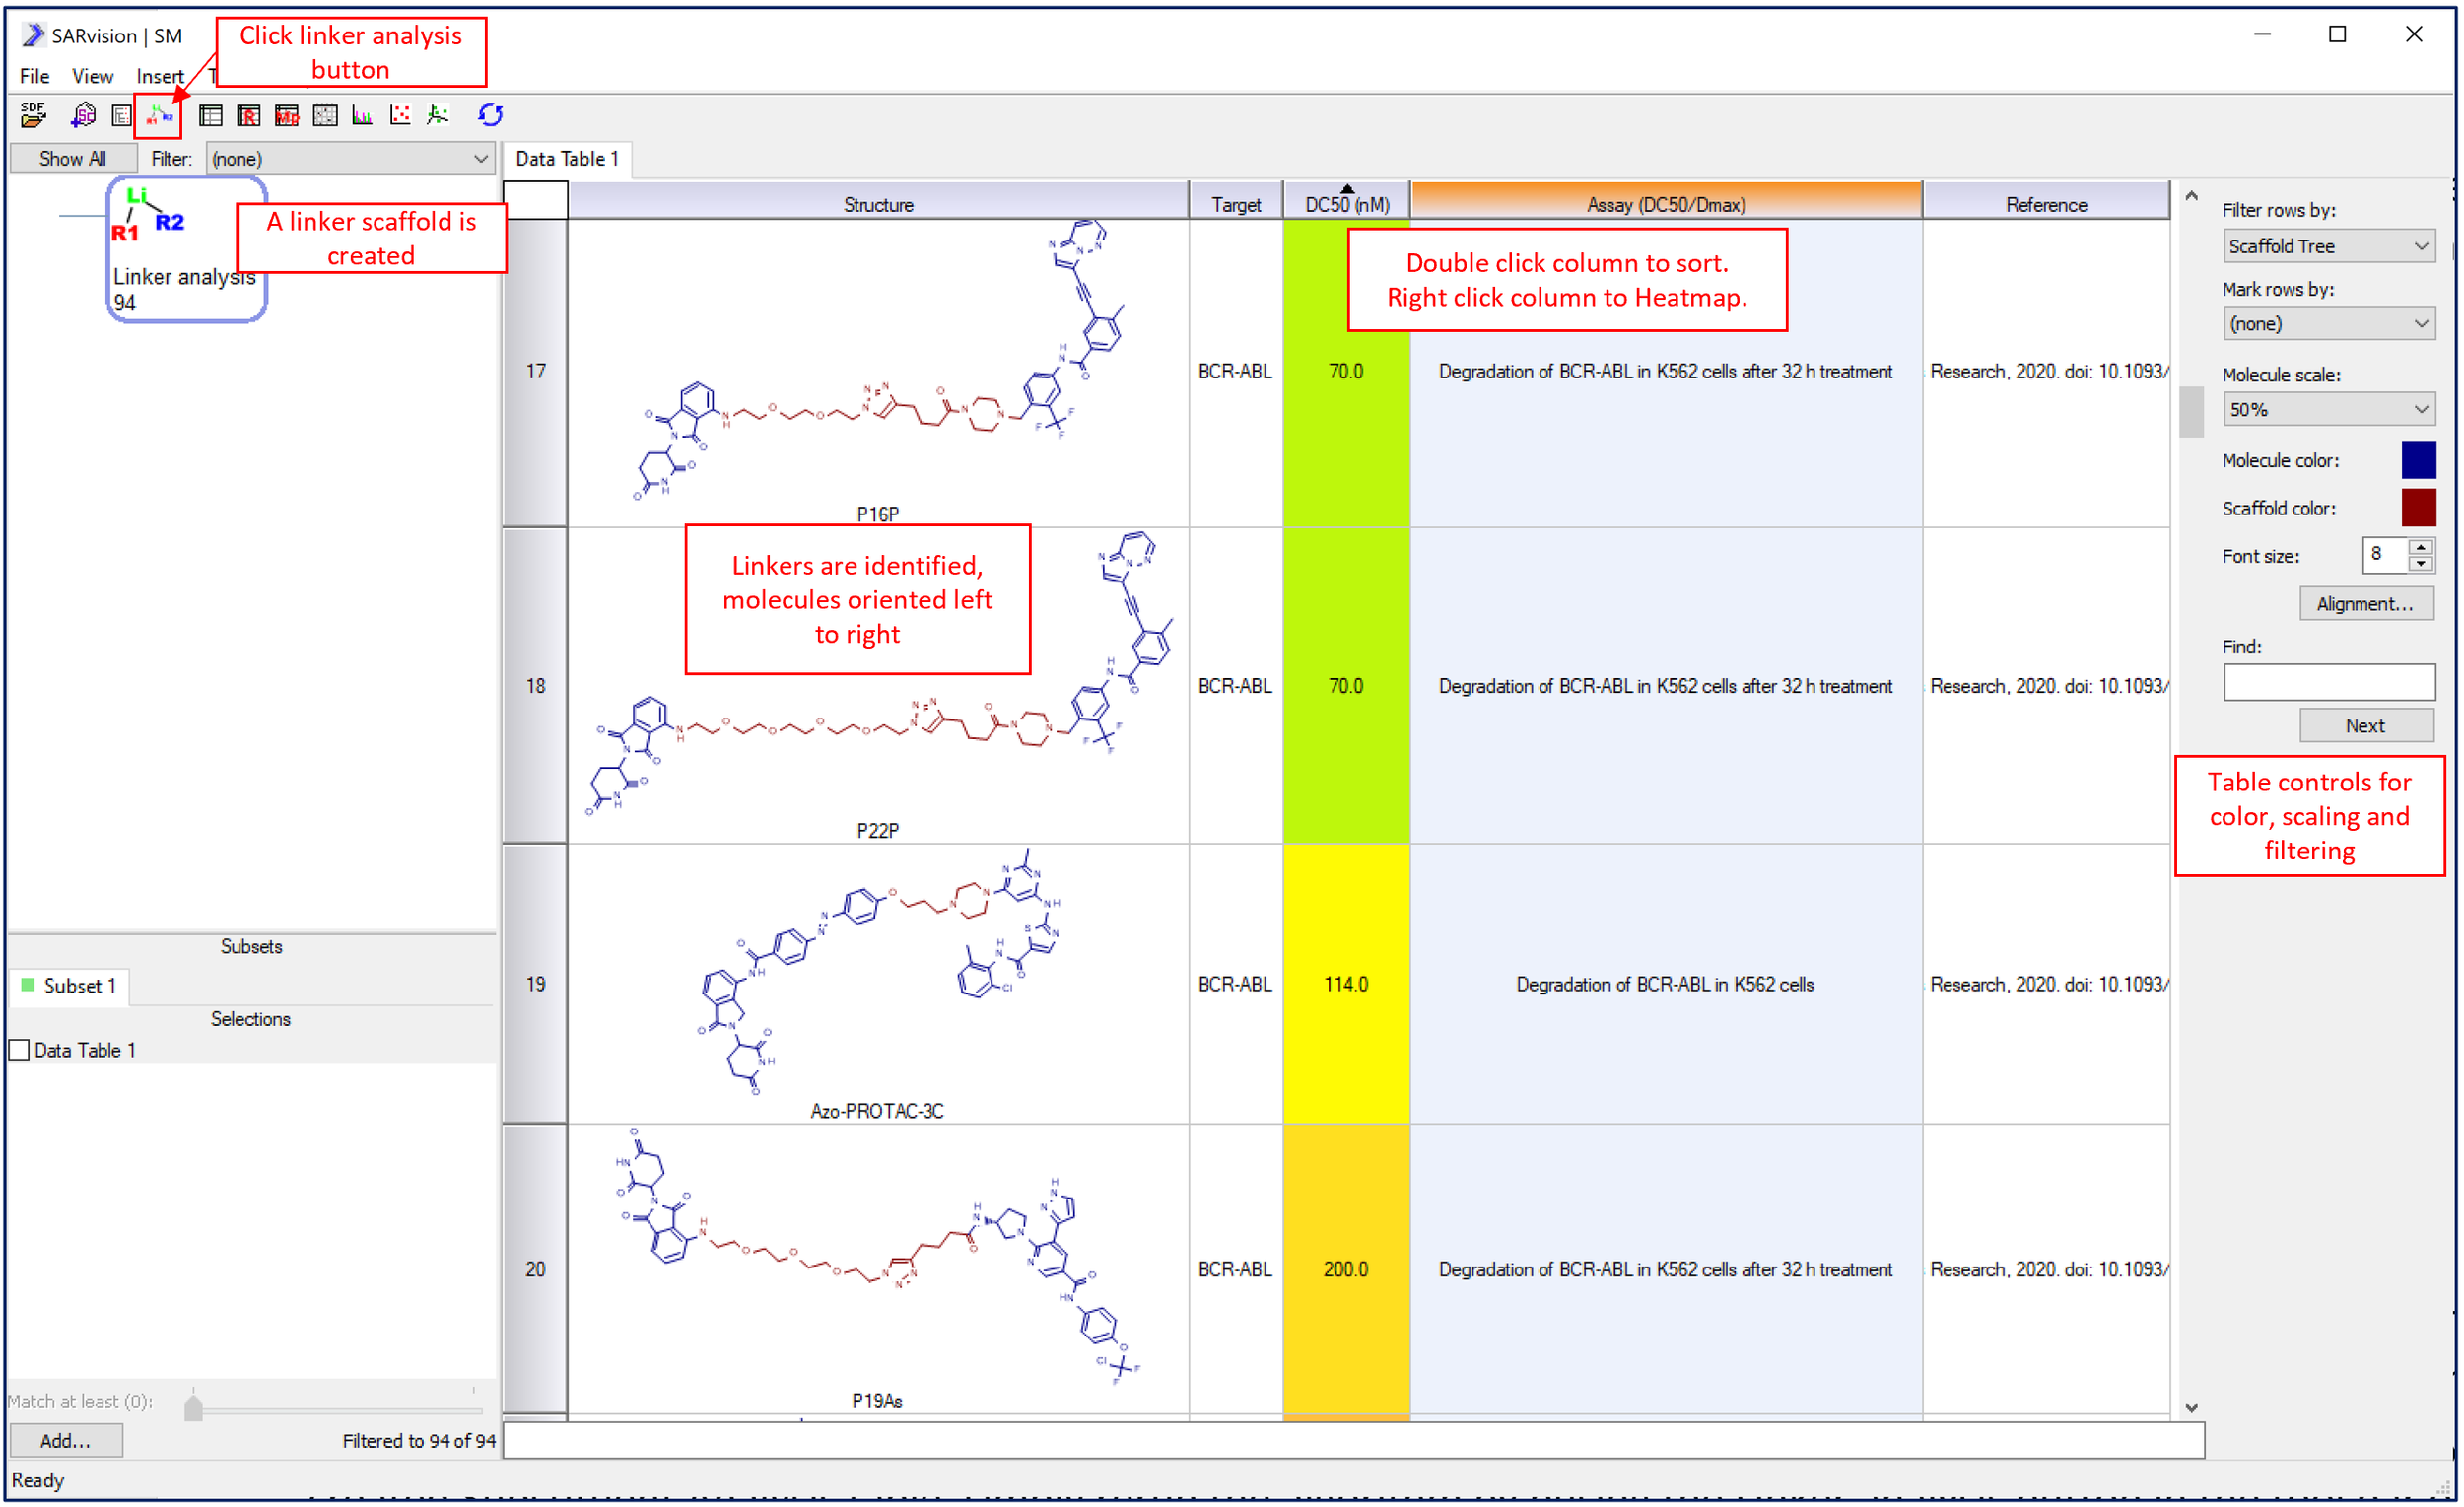
Molecules and any associated data will appear in the molecule Data Table. Once the molecules have been loaded, click the Linker analysis button to perform the analysis. The algorithm processes the molecules and populates any open tables: Data Table, R-Group Table, Data Grid and Substituent Analysis table are the most relevant. This step identifies the linker highlighting it in red (default color), reorients the molecules such that the E3 ligase ligand is on the left and the target warhead is on the right. Rows can be sorted by any data column which in turn can be heat mapped by value as shown for DC50(nM) below.
An R-Group table and a Substituent analysis table can be added by clicking on the appropriate buttons in the toolbar (see figure below). When the Linker analysis algorithm runs, these tables get populated with the three components of the PROTAC molecules: E3 ligase modulator (R1), linker (Linker), and targeting warhead (R2). The PROTAC molecules are broken apart in the R-Group table, and the E3 ligase ligand is placed in the R1 column, the linker in the Linker column, and the targeting warhead in the R2 column. All the functions of the R-Group table are available to filter, sort, and heat-map the table.

The R-Group table breaks the PROTAC molecules into the constituent parts and places these into R1, R2 and Linker columns. This table can be sorted, heat-mapped and filtered to facilitate SAR analysis.
To populate a newly created Substituent Analysis table, simply rerun the algorithm by pushing the Linker analysis button in the toolbar or double-clicking the linker Scaffold. Molecule pairs are built based on single differences in one of the three components of the PROTAC to populate the Substituent Analysis table. These molecular pairs can be filtered by component or data to identify a single structural change that drives activity.
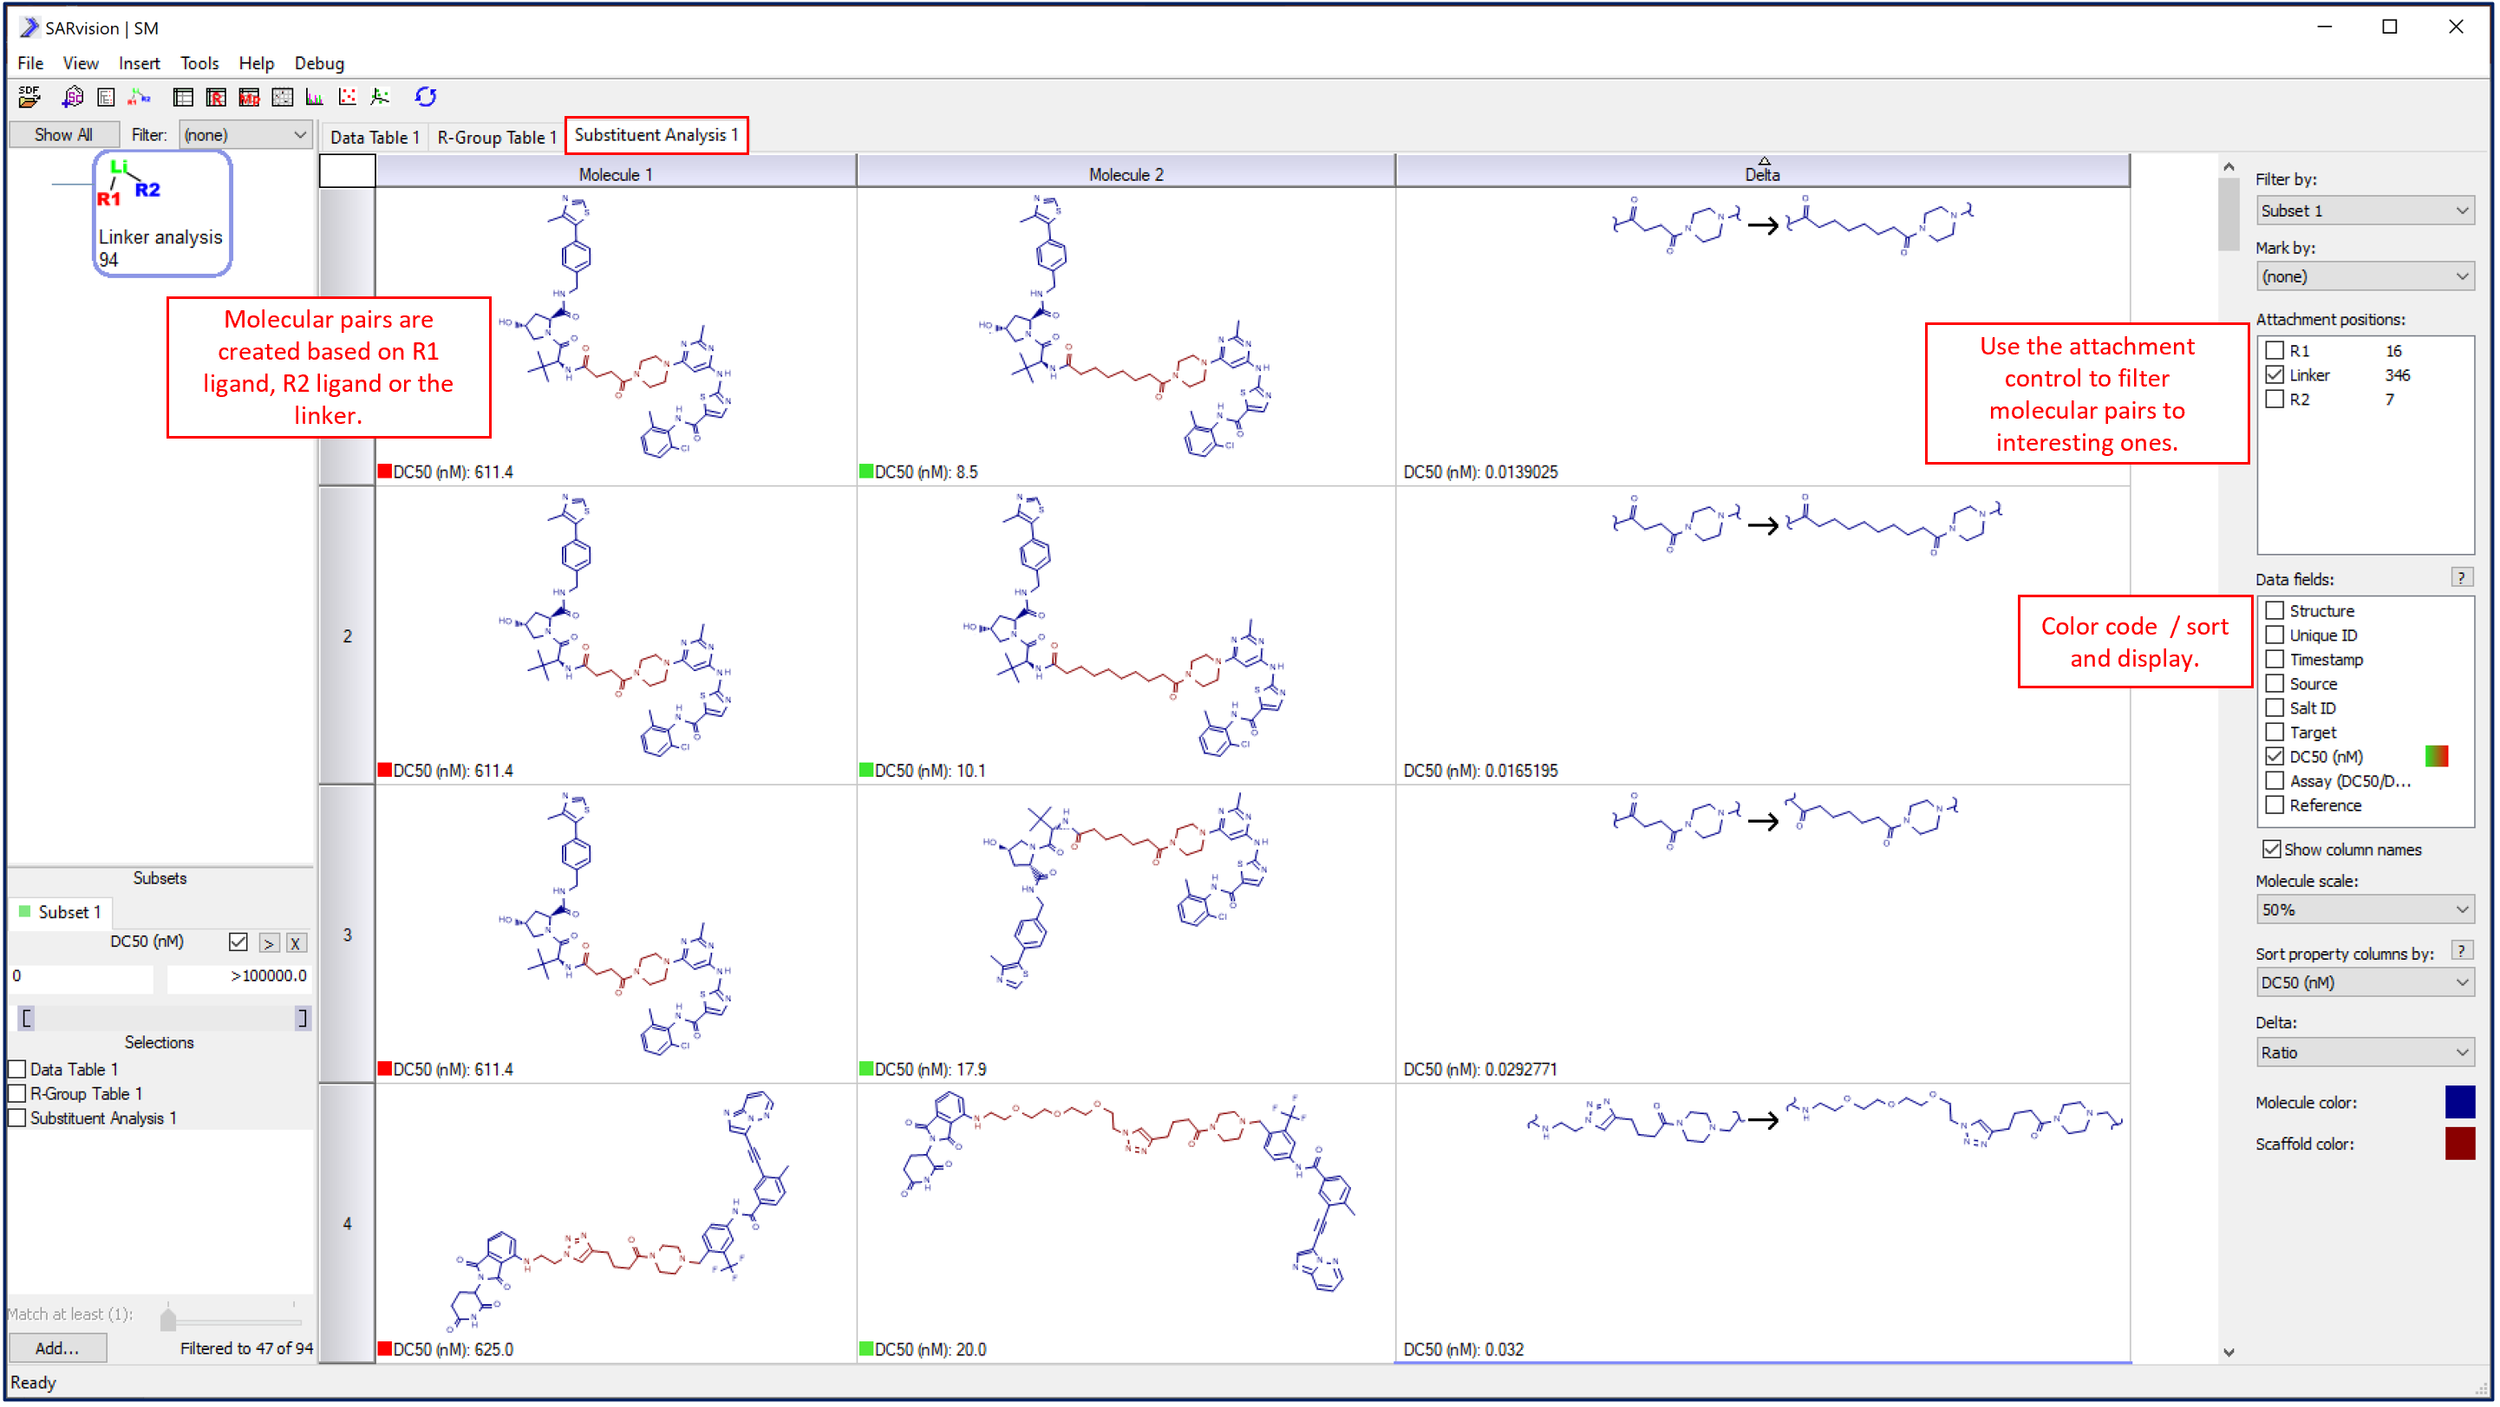
PROTACS are broken into molecular pairs on each row based on changes in only one of the ligands or the linker.
Calculate property columns for the entire PROTAC molecule and each part of the molecule: Tools->Calculate molecular properties. These added properties will appear in the Data Table and the R-Group Table and can be used to help facilitate SAR analysis.

A number of properties can be calculated for each PROTAC, each ligand in the PROTAC molecule and for the linker.
For more information contact us.