
Molecule Data Grid | Data Grid | Structure Activity Relationships | SARvision
Creating High Density Data Grids of Molecules
by Mark Hansen, Ph.D.
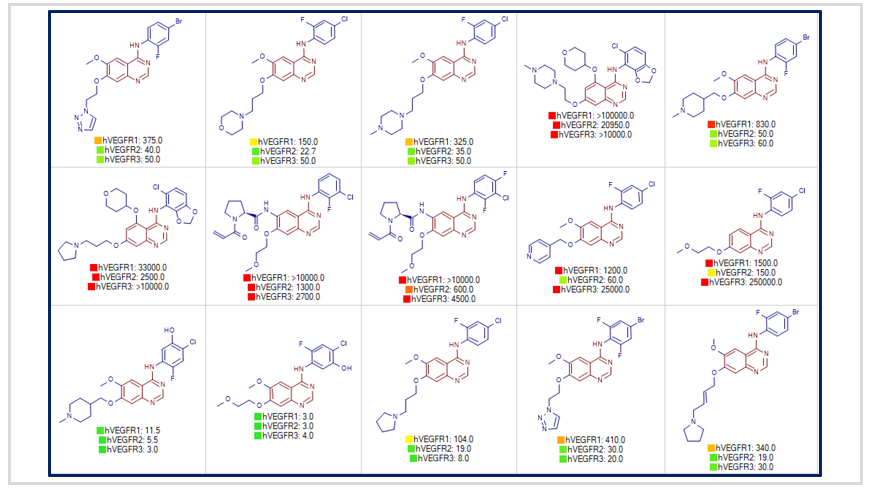
A Molecule data grid is a nice compact way to show high density data.
Often times it is useful to create high density molecule views in which molecules are arranged in a checkerboard fashion. In the molecule data grid, molecules are arranged in sequential cells with from left to right and top to bottom. Under each is a set of relevant data describing each molecule. This table behaves very much like the molecule spreadsheet: the data-grid can be subset by a scaffold (double click on a scaffold) or data (used subset panel). It can be exported to Excel and Word to rapidly create reports (right click->Data Grid tab options).

A molecular data grid displays molecules and data in a nice compact form.
In SARvision, select main menu->Insert->Data grid. To filter the molecule data grid table, double click on any scaffold substructure to apply a substructure filter. This will reorient the molecules that belong to this scaffold and color code them based on the scaffold structure. The data displayed under each molecule can be selected by a check box in the table control on the right side. Right click on any column in the check box control to create a heat-map icon next to the values in the table. To export this view, right click on the Data Grid tab.