
SARvision | SAR | Molecule Spreadsheet | Molecule Alignment | Structure Activity Relationships
Create a Molecular Spreadsheet to Explore SAR
by Mark Hansen, Ph.D.
Load a molecule file (SDF or CSV with smiles) to create a molecule spread sheet to study Structure Activity Relationships in your data.
Using SARvision, research scientists can easily build spreadsheets containing structures of their molecules and any data associated with their molecules such as biological and pharmacological assay data including text and numeric values. In SARvision|SM, the main menu->Import molecules opens a browser that allows one to navigate and open a molecule file. MOLFILE formatted files (*.sdf) are ideal for this use as these can be downloaded from the web or generated from your own internal corporate database. Alternatively, comma delimited files (*.csv) that contains a column of molecules in SMILES format can be easily imported. Contact your IT group for help if necessary to obtain current molecule files with data for your project. Molecules will appear with the molecule in the left most column. Any other associated data included in the file will appear as columns located to the right of the structure column.
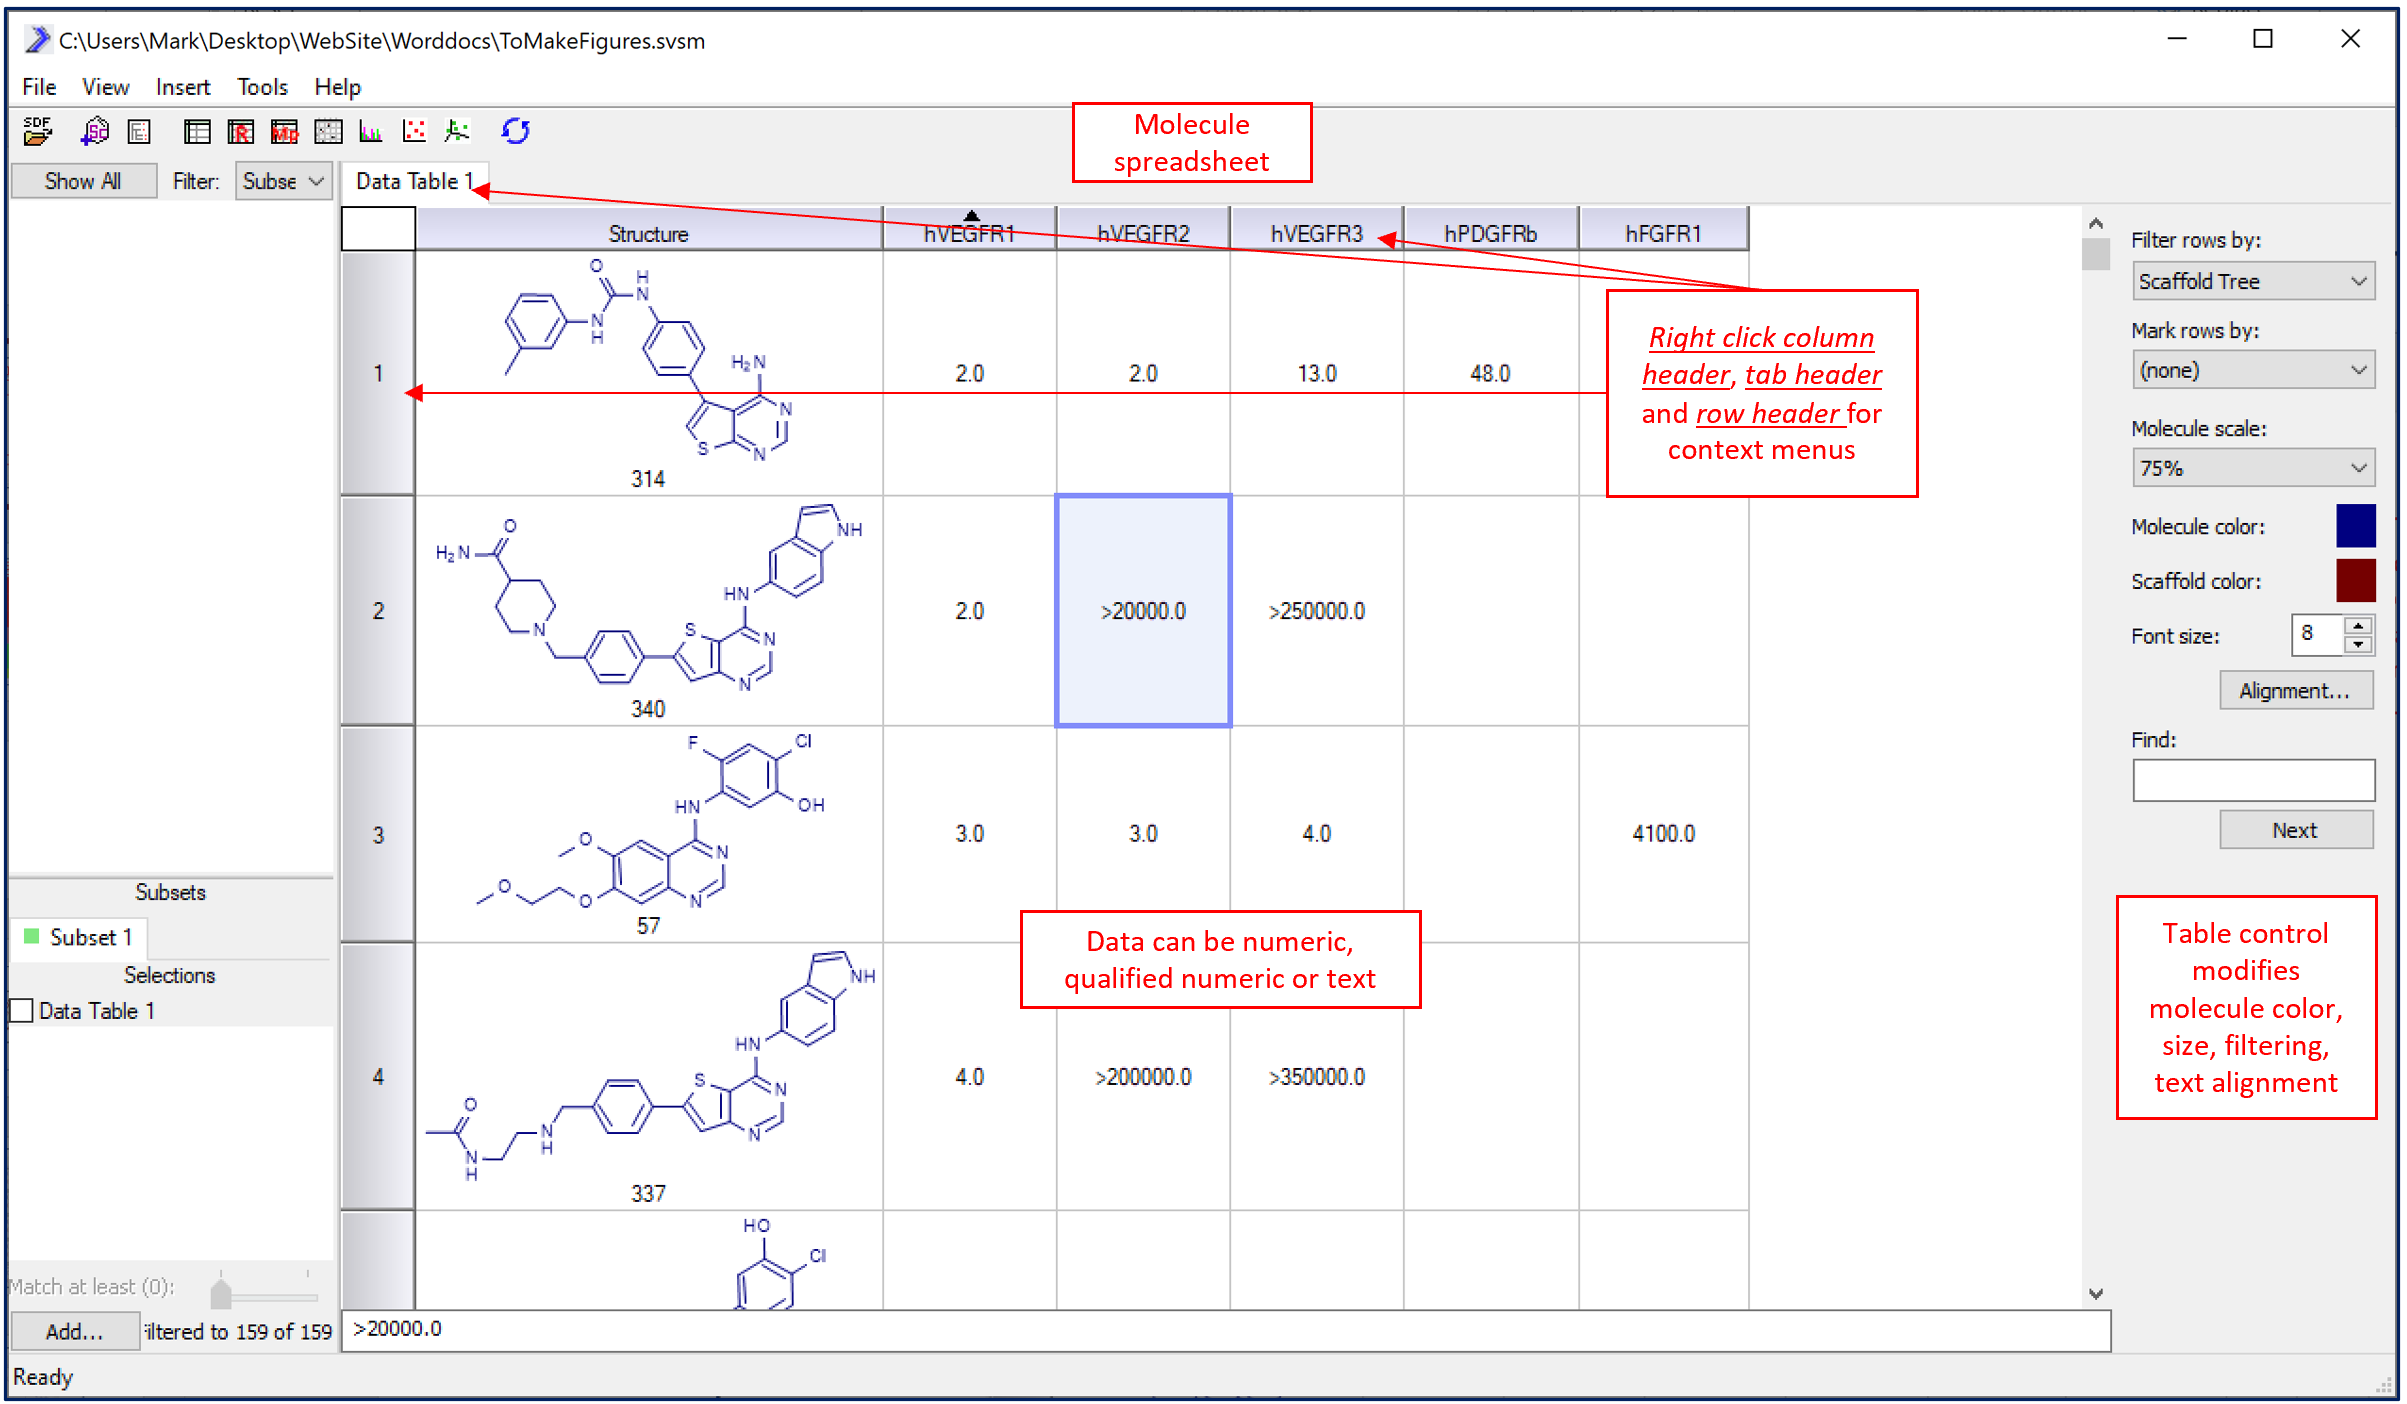
A typical molecule spreadsheet. Right click on row headers, spreadsheet header tab, column header and cells to get context menus to modify objects. Click on any data cell to modify or add data.
The molecular table is a fully functional spreadsheet similar to those used in other programs like Excel. Rows can be sorted by data in any column (double click the column header to sort), columns can be hidden and reordered, and columns can be heat-mapped to highlight key activity data. Additional data can be added or calculated using the main menu->insert functionality. Adding a Column adds an empty column on the end of the data-set that the user can type in data, comments or other information. Adding an Expression allows the user to mathematically transform another column; for example the log() function can be applied to another column to create a new one.
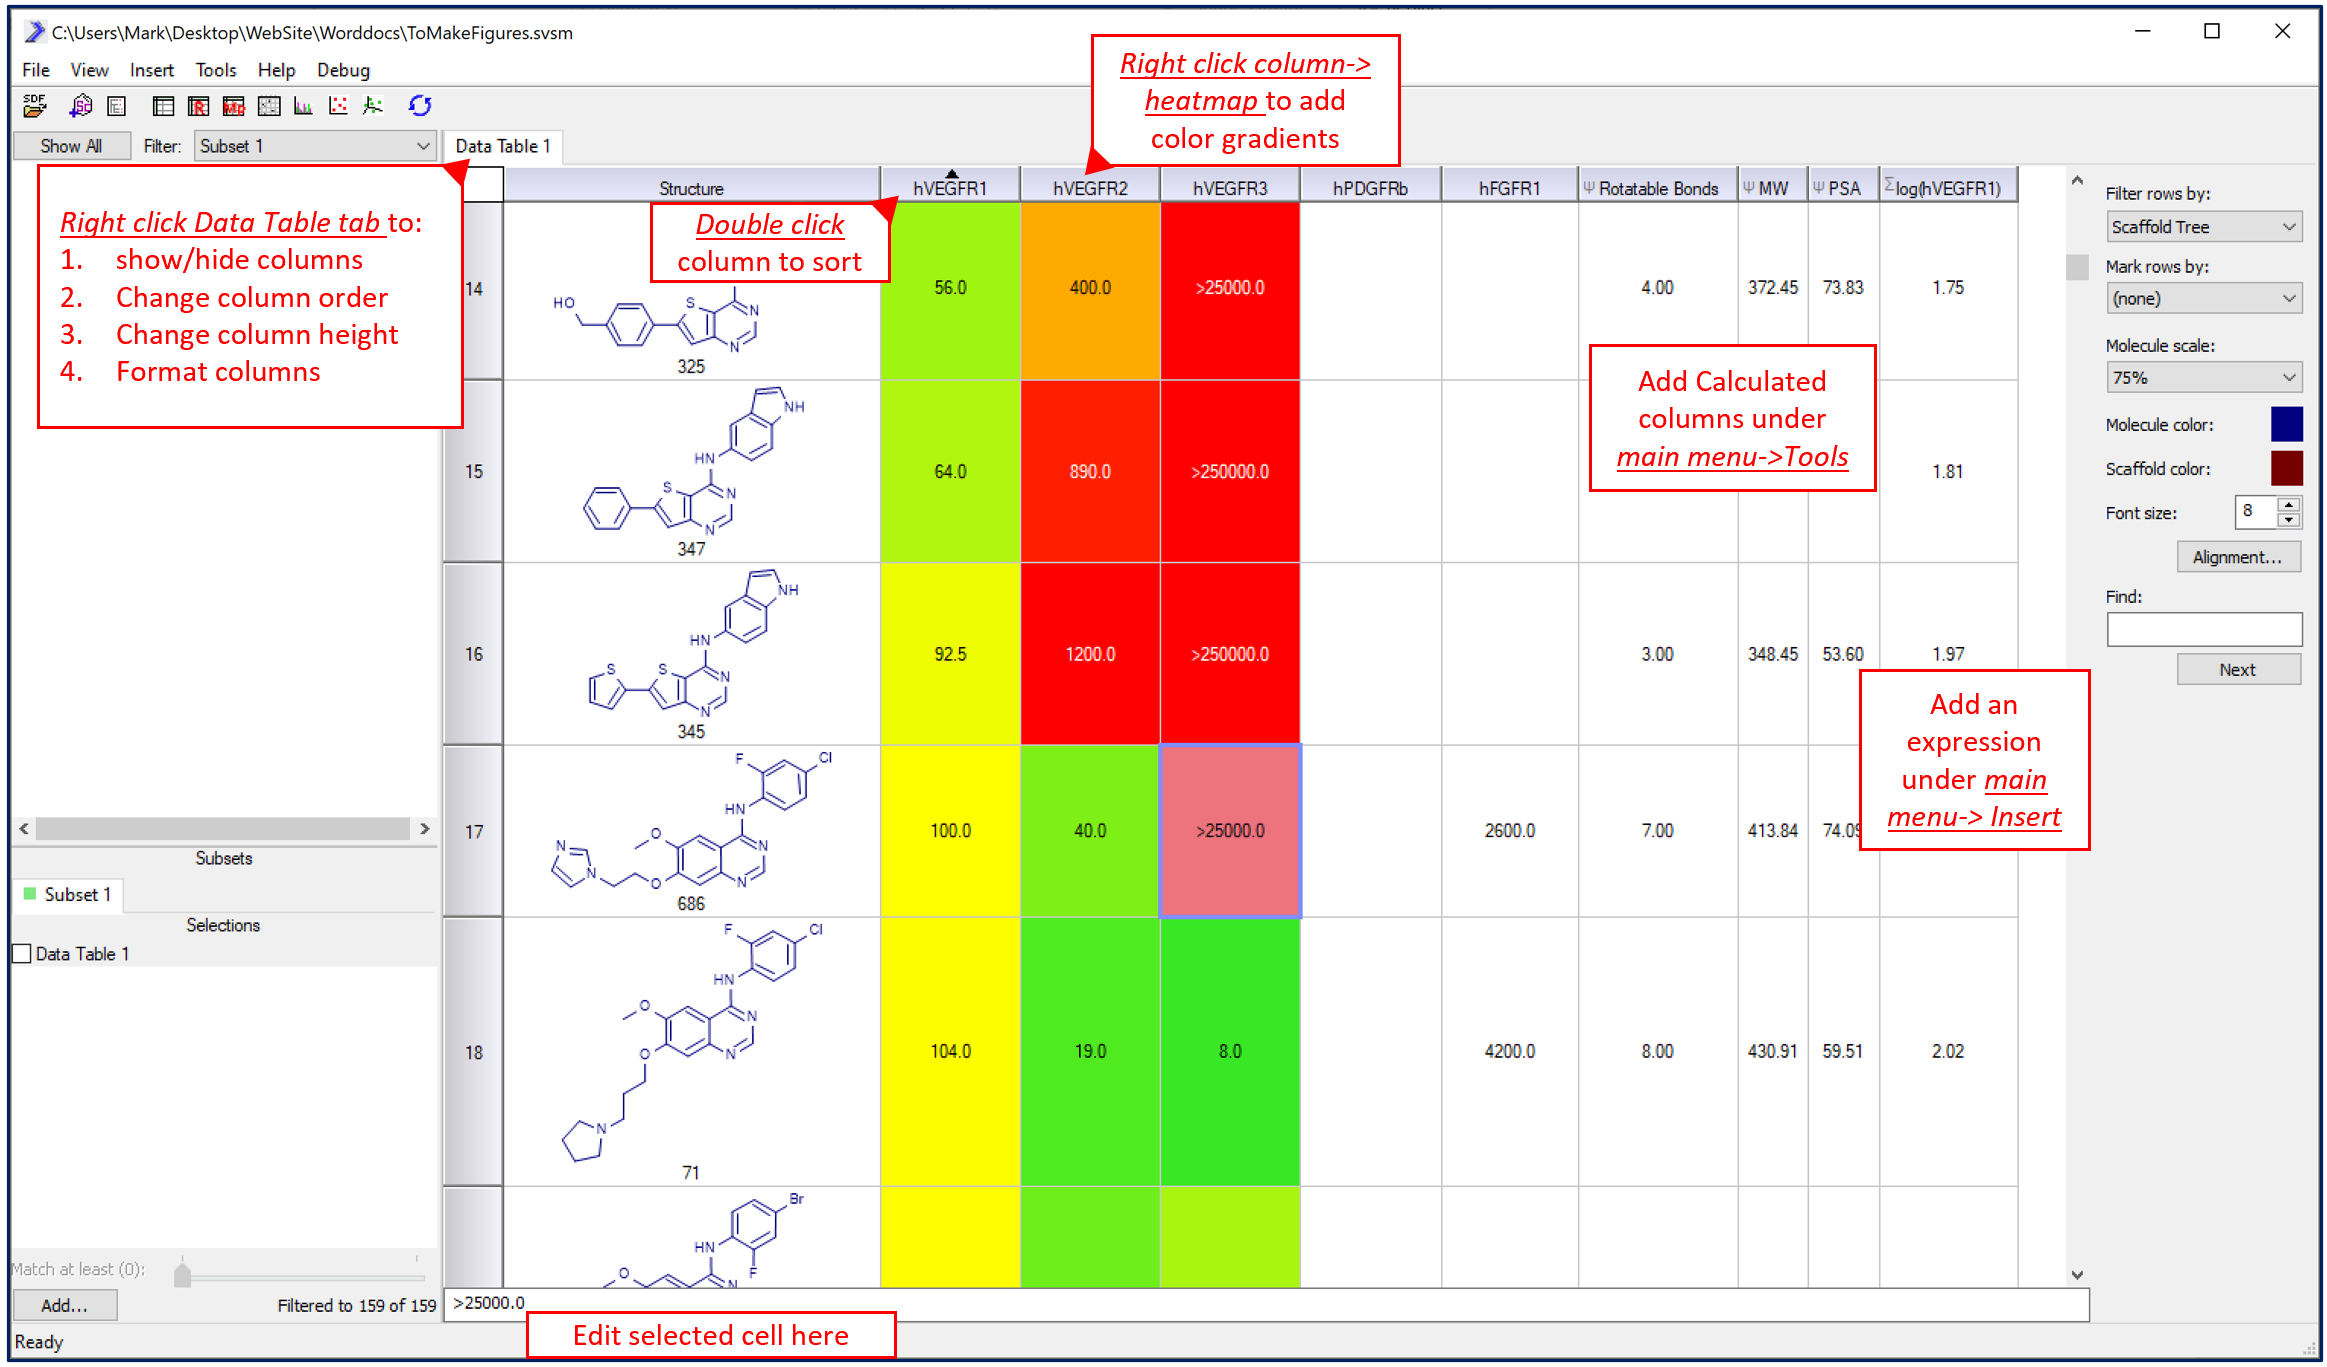
Molecular spreadsheets can be sorted, edited, heat-mapped and cells formatted to help identify trends in biological assay data. Under Data Table tab (right click) export to Excel/Word.
Molecules can be grouped by a common structural core termed a scaffold to create families of related molecules. In SARvision|SM any number of scaffolds can be added for analysis; or scaffolds specific to this dateset can be auto-generated. By right clicking in the scaffold pane (panel to the left) options to draw a scaffold, to auto-generate scaffolds (right click->Add scaffold… and right click->Identify scaffolds…) and many other scaffold functions are available. Molecules in SARvision can be aligned and color coded relative to any scaffold by double clicking on the scaffold of interest. Additionally, clicking on scaffolds can generate other views such as R-Group tables and scaffold centered molecular pair tables.

Molecules cluster in related series based on scaffold substructure. Draw a scaffold and double click on it to filter, color code and align molecules to the selected scaffold for easy analysis.
Under main menu->tools are options to upload data from an external csv or tab delimited table as extra columns and the ability to calculate some simple physico-chemical properties for the molecules (and later for R-Group analysis). These columns will appear to the right of existing columns. Note that columns can be rearranged or hidden using a Columns UI control that is accessible by right-clicking on the Data Table tab.
Finally, there is a fully functional filter panel to create subsets of data based on textual or numeric data. This panel, located on the lower left, can be used to subset (or highlight) rows in the molecule spreadsheet that satisfy a user defined range of properties. In the same way that scaffold subset molecules based on substructure, these range filters can subset molecules based on properties. Note that scaffolds and filters can operate independently or additively on the spreadsheet.

Filter data by scaffold substructure and/or data ranges to see only relevant molecules in the spreadsheet.